
Forecast Dashboard |

|

|

|
|
Forecast Dashboard |
|
|

|
Forecast Dashboard |
|
|
|
|
Forecast Dashboard |
|
|
|
The Forecast Dashboard is available in the Preferred edition of Envision Cloud. You can upgrade your account on the Account Subscription page. |
The forecast dashboard allows you to view upcoming sales, based on appointments that are booked on the schedule for the selected date range. This is different from the Daily Dashboard's Forecast screen, which only reflects a single day.
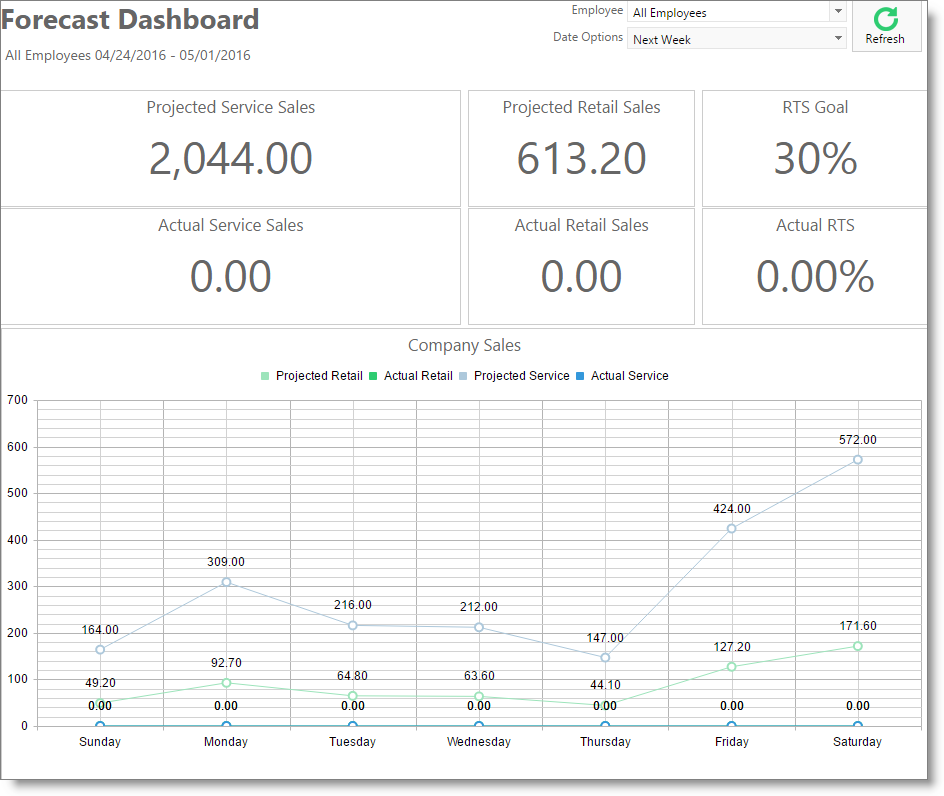
Projected Service Sales
This section shows the service sales estimated to be performed for the selected date range.
Projected Retail Sales
This section shows the retail sales estimated to be made for the selected date range. This number comes from multiplying the projected service sales by the RTS goal percentage.
RTS Goal
This reflects the RTS goal entered in the Company Settings.
Actual Service Sales
This section shows the service sales made for the selected date range. If the date range includes today's date, this shows the service sales made so far.
Actual Retail Sales
This section shows the retail sales made for the selected date range. If the date includes today's date, this shows the retail sales made so far.
Actual RTS
This section shows the retail to service percentage for the selected date range. If the date includes today's date, this shows the retail to service percentage so far.
Forecast vs Actual Graph
This graph displays the projected and actual totals per day.
