
Forecasts Dashboard |

|

|

|
|
Forecasts Dashboard |
|
|

|
Forecasts Dashboard |
|
|
|
|
Forecasts Dashboard |
|
|
|
The Daily Dashboard is a quick and easy way to see critical business information for the day. This screen can be used as a reference on how the business is doing for a date. If the selected date is today's date, this shows the information as of the current time for today.
![]()
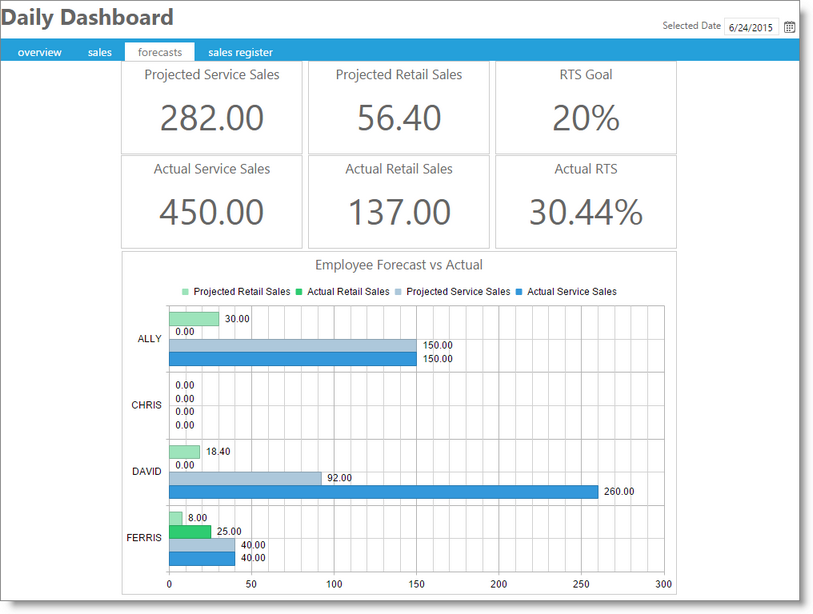
Projected Service Sales
This section shows the service sales estimated to be performed for the selected date.
Projected Retail Sales
This section shows the retail sales estimated to be made for the selected date.
RTS Goal
This section shows the retail to service percentage goal for the selected date.
Actual Service Sales
This section shows the service sales made for the selected date. If the date is today's date, this shows the service sales made so far today.
Actual Retail Sales
This section shows the retail sales made for the selected date. If the date is today's date, this shows the retail sales made so far today.
Actual RTS
This section shows the retail to service percentage for the selected date. If the date is today's date, this shows the retail to service percentage so far today.
Employee Forecast vs Actual Graph
This graph displays the projected and actual totals per employee.
