Comparison Dashboard |

|

|

|
|
Comparison Dashboard |

|

|

|
|
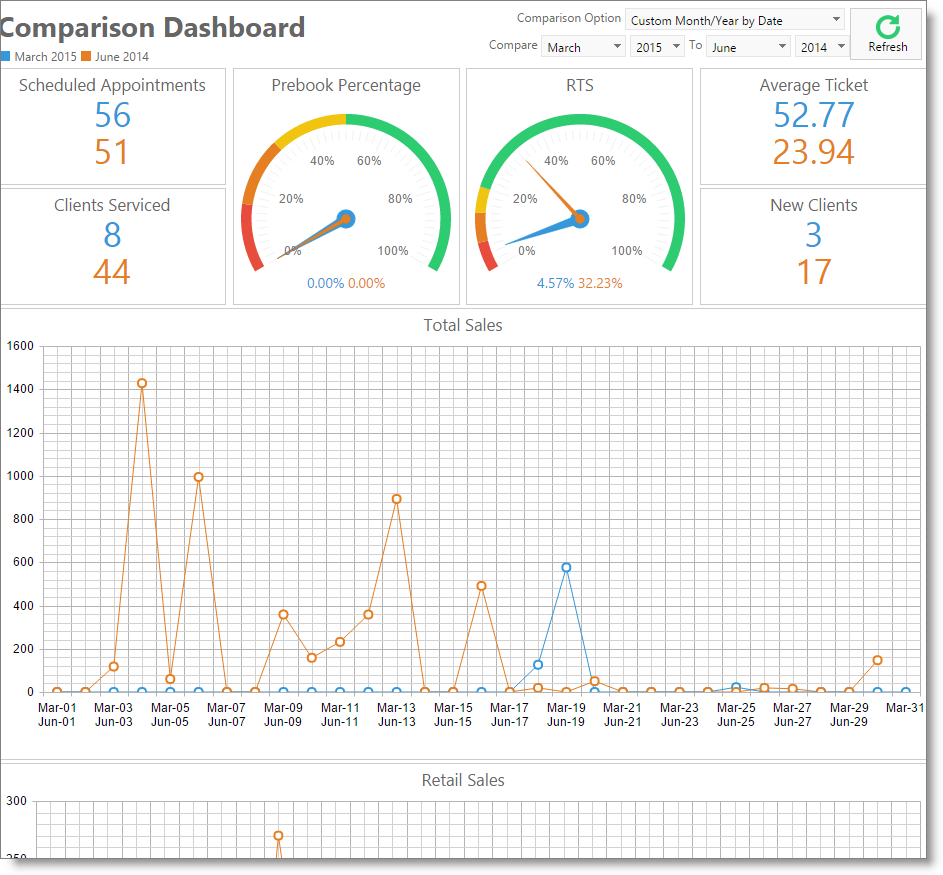
The comparison dashboard shows business information in a date range, as compared to a second date range. Choose the date range selections to the upper right of the screen in the comparison options, and click the refresh button to update the information if the date ranges are adjusted.
![]()

Comparison Option
Select the date range options you wish to compare from the drop down. |
|
Refresh
Click the refresh button to update the numbers for the comparison date selections.
Scheduled Appointments
The number of appointments on the appointment calendar in the comparison date selections.
Clients Serviced
The number of clients who had services performed in the comparison date selections.
Prebook Percentage
This graph shows the percent of prebooks for appointments in the comparison date selections.
RTS
This graph shows the retail to service percentages for the comparison date selections.
Average Ticket
The average dollar amount for transactions in the comparison date selections.
New Clients
The number of new clients in the comparison date selections.
Total Sales
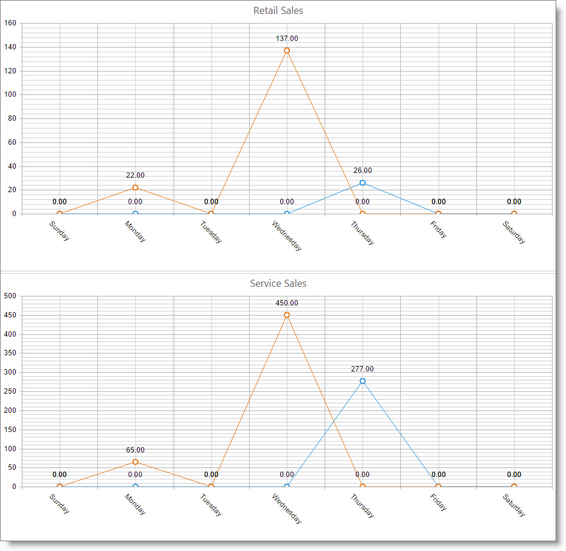
This graph shows the total sales in the comparison date selections. Further down the page, the sales are separated into retail, service and gift card sales.
