Report Query Screens |

|

|

|
|
Report Query Screens |

|

|

|
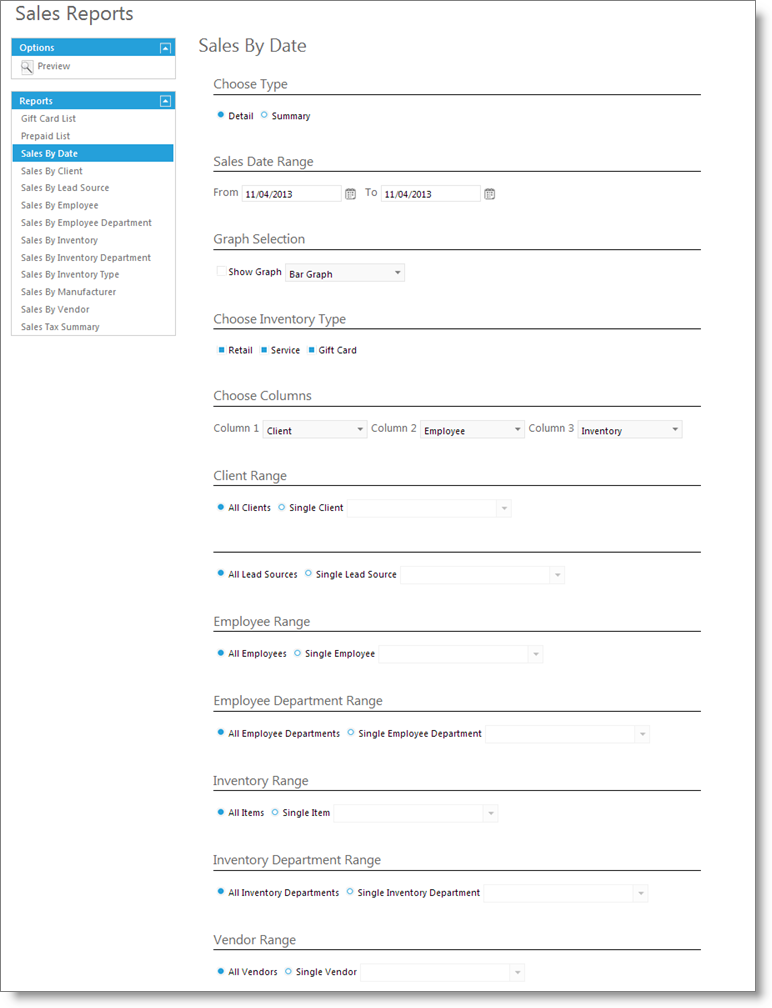
Envision has powerful reporting capabilities. Each report you select will first ask you to select what data you wish to display on the report. This is done through the use of a Report Query screen. A sample query screen is shown below. These screens will vary for each report but will have the same layout as this sample.
To run Reports, hover over Reports in the Tool Bar of Envision Cloud. The drop down menu will display several categories for reporting. Select the desired reporting category and a screen similar to below will open with different reports available for selection in the Side Bar on the left.
![]()

Select Report Type
When there are variations on a basic report (for example, one report called "Detail" and another report called "Summary"), the report you chose will be checked but you may select one of the other variations here.
Select Date Range
Click the large "Select Dates" button and you will see a screen with two calendars for setting the beginning and end dates.
Graph Selection
If you wish the report information to display in a visual graph, you can choose which graph to render.
Item Types
Include or exclude different data for different item types to display on the report.
Select Sort and Range Options
Depending upon which report you have selected, the items shown in this area of the screen will vary. The Sort options allow you to specify what type of information you would like to see in the first columns of the report. The Range allows you to view information for all items selected, a specific item, or a range of items. The options available will vary from report to report depending upon what applies.
Preview
Click this button to display the report on the screen. You may send it to the printer from the preview screen.